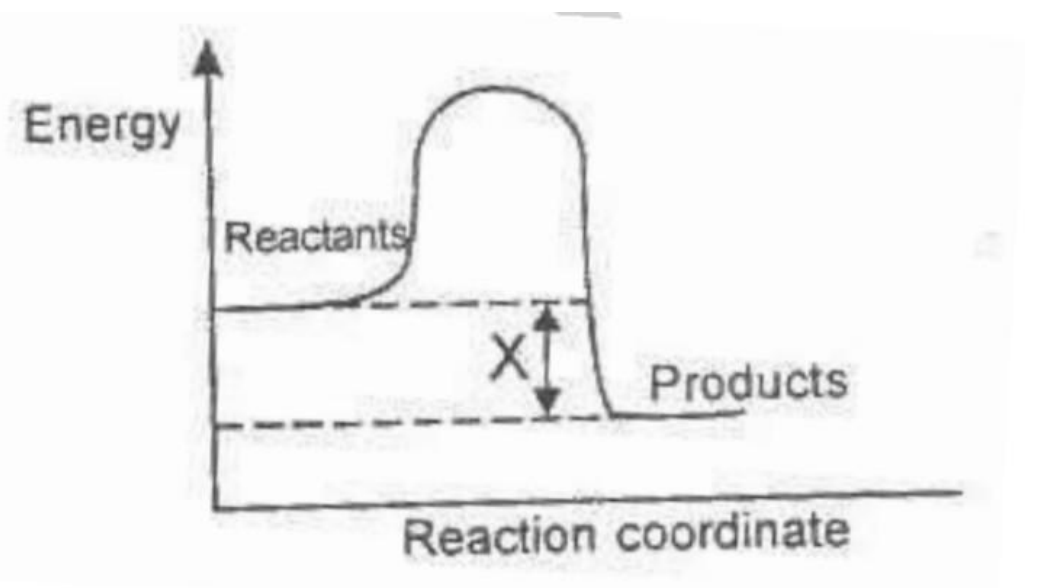
In the diagram above, X is the
enthalpy
enthalpy change
activation energy
activated complex
0
Explanation: In a reaction–coordinate diagram, the vertical gap between the energy level of reactants and the energy level of products represents the enthalpy change, \( \Delta H \), of the reaction (here it’s negative because products lie lower than reactants). The activation energy is the gap from reactants up to the peak, and the activated complex is the species at that peak.
Don't miss the opportunity to help others. Register or log in to add a solution!
Help the community by answering some questions.