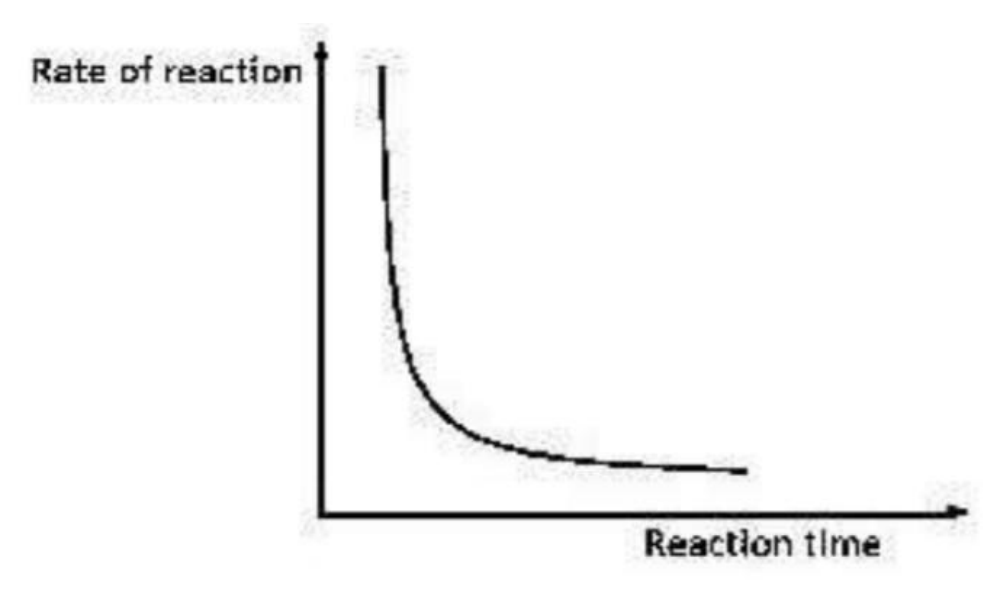
The diagram below best illustrates the effect of decrease in
The diagram above best illustrates the effect of decrease in
concentration
temperature
surface area
pressure
0
Explanation: The graph shows the reaction rate starting high and then falling rapidly before leveling off as time passes. This is exactly what happens because the reactant concentration decreases during the reaction. Fewer particles → fewer effective collisions → lower rate. Temperature, surface area, and pressure would not naturally decrease just because time passes; they must be changed externally.
Don't miss the opportunity to help others. Register or log in to add a solution!
Help the community by answering some questions.